

Dashboard
The Dashboard is the first page you land on after signing in, and its job is to answer one question at a glance: how is the business doing? Four number tiles across the top give you the headline figures, three charts break the year down month by month, and two small controls that live beside every page (your available hours and the notifications bell) keep you posted while you work.
Everything on this page is calculated from the work you have already entered, so a brand-new account starts out empty and fills in as you create services, price them, and send estimates.
TIP
If you share the account with a team, you only see the sections your role gives you access to. Someone who cannot view services sees the Dashboard without the four tiles, Revenue vs Profit and Services Completed; Estimate Outcomes still shows as long as they can view estimates.
Your headline numbers
The first three tiles cover the current calendar year and reset each January. Pipeline is different: it is a snapshot of the work open right now, whenever it started, so it does not reset.

- Total Revenue is what your finished work brought in this year. It adds up the target price of every service you completed, priced, and had accepted. A service you completed without ever choosing a price counts as zero here, the same way it does in Pipeline — but the profit recorded against it still counts, so completed work you never priced can push Profit Margin higher than the work really earned. A small line under the number traces the same figure across the months of the year.
- Total Profit is what you actually kept out of that revenue, once the cost of doing the work is taken out. It has its own line chart underneath.
- Profit Margin is your profit as a share of your revenue, rounded to a whole percent. Until you have revenue this year, it shows a dash rather than a number.
- Pipeline is the money still in motion: the target price of every service whose status is In Progress. Drafts and past-due services are not counted, so a service only joins the pipeline once you move it into progress. A service you have not priced yet counts as zero, so the pipeline number grows as you price the work you have taken on.
Reading the first two tiles together is the useful part. Revenue tells you how much work you sold, profit tells you whether the price was worth selling it at.
The charts
Below the tiles, three charts break the same year down month by month. Hovering over any bar shows the exact figures for that month.
Revenue vs Profit
A blue bar for each month's revenue sits next to a green bar for that month's profit, so you can see the gap between the two widening or narrowing across the year.
The green bar sometimes carries a lighter shade on top, labeled Rounding in the legend. That slice is profit you earned because your burn rate was rounded up to a friendlier number. It is real money, but it comes from rounding rather than from the price you set, so it is shaded separately instead of being hidden inside the profit bar. If you have rounding turned off, the shade simply never appears. See Burn Rate for how the rounding works.
Estimate Outcomes
This chart shows how your estimates ended, month by month, stacked into four outcomes:
- Accepted means the customer said yes.
- Ghosted means the customer never came back to you.
- Canceled means the job was called off.
- Denied means the customer said no.
Estimates only appear here once they have an outcome, and they land in the month the decision was made rather than the month you sent them. A tall stack of ghosted estimates usually says something about follow-up; a tall stack of denied ones usually says something about price. Managing estimates explains how estimates reach each outcome.
Services Completed
The last chart counts how many services you finished in each month, regardless of what they were worth or how they were priced. It is a measure of throughput rather than money, and it pairs well with Revenue vs Profit: a busy month with thin profit is worth a closer look.
Business Workflows
The How to get started button at the top of the Dashboard opens the Business Workflows panel, a short checklist of what to set up first depending on the kind of business you run. All three columns are shown on every plan, so pick the one that matches you:
- Side Hustler starts with a company, then a service, then optionally an estimate.
- Solopreneur starts with your personal and business expenses, then the company, the service, and the estimate.
- Growing Business starts with expenses, then employees so their salary and billable hours are tracked, then the company, service, and estimate.
Every step in the panel is a link, so you can work straight through the list. If a link leads to a page your plan does not include, it opens read-only with an upgrade notice rather than turning you away. Close the panel with Got it when you are done; it is always one click away again from the same button. For a fuller walkthrough of each path, see Workflows by business type, and for the initial setup of the account itself, see Quick Setup.
Available hours
Once you have set up your burn rate, a small clock icon with a bar beside it appears near the bottom of the sidebar (or in the header bar on a phone). Until you have sellable hours to show, the spot stays empty.
That bar is your year's sellable time: the filled portion is the hours already committed across your services, and the empty portion is what you have left to sell.
Click the bar to open the Available hours panel, which shows the same split as a donut chart divided into Used and Remaining hours. Where those hours come from depends on how your burn rate is calculated, which your plan decides. On the Side Hustler and Solopreneur calculations they come from the working time you set on your Burn Rate page; on the Growing Business calculation they come from your employees' billable hours, so adding or removing an employee moves the total right away, and the bar stays hidden until someone is on the team.
WARNING
When you commit more hours than you have for the year, the bar is replaced by a red warning triangle. It means the work already on your books needs more hours than the year has available, so either the schedule needs revisiting or some work needs to move.
Because the bar sits in the sidebar, it follows you across the whole application, not just the Dashboard. Burn Rate covers how your hours feed into your pricing floor.
Notifications
The bell icon beside your profile at the bottom of the sidebar (and in the header bar on a phone) is where Priscale tells you what happened while you were working. A small badge on the bell counts your unread notifications, showing "99+" once you get past ninety-nine. With nothing unread, there is no badge at all.
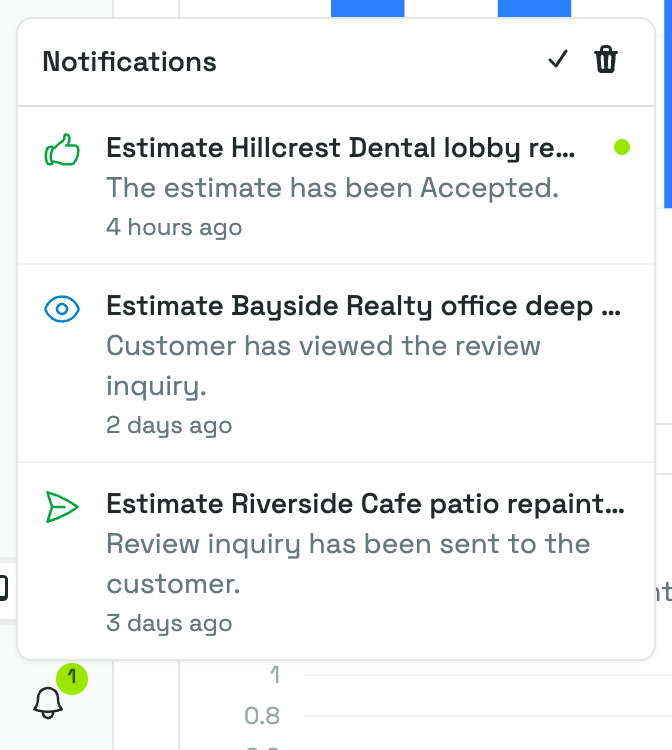
What the panel shows
Click the bell to open your fifteen most recent notifications, newest first. Older ones are no longer listed, so act on anything you care about while it is still in view.
- Each row carries an icon, the title, a line of detail, and how long ago it arrived, with a dot on the right while it is still unread.
- Selecting a notification marks that one as read and opens the estimate it came from, on its Send Estimate step.
- Two small buttons sit in the top corner of the panel, and each one appears only when it has something to do. The check marks everything as read (Mark all as read) and shows up while you have unread notifications; the list itself is left alone. The bin beside it empties the list for good (Clear all) and shows up while the list has anything in it. On an empty list, neither button is there.
- Clearing is the only thing that removes a notification. Reading one never does, and nothing is tidied away on a schedule. The fifteen is a limit on what the panel lists rather than a deadline, but since the bell is the only place notifications appear, anything further back is out of reach in practice.
- Before anything has arrived, the list simply reads No notifications yet.
TIP
Every notification goes to everyone on your team, but each of you gets your own copy. Marking yours as read, or clearing your list, never changes what a teammate sees in theirs.
What each notification means
Today, every notification comes from an estimate you sent out for review. The title names the estimate and the stage its recipient's link reached, and the line underneath tells you what actually happened.
| What happened | What the notification says |
|---|---|
| The email left Priscale and your recipient's link went live | Sent — Review inquiry has been sent to the customer. |
| The email could not be delivered | Error — An error occurred while sending the review inquiry. |
| Your recipient opened their link | Viewed — Customer has viewed the review inquiry. |
| Your recipient approved the estimate | Complete — The estimate has been Accepted. |
| Your recipient declined the estimate | Complete — The estimate has been Denied. |
That is five messages out of four statuses: the last two both arrive titled Complete, and what tells an approval from a decline is the line underneath it, along with the thumbs-up or thumbs-down icon beside it. The icon's color is the quickest read of all — green for sent and accepted, red for an error or a decline, blue for a first view.
Opening a recipient's link yourself while you are signed in to Priscale does not raise a Viewed notification, so you can check what they will see without it showing up here.
TIP
Sending, Expired, and Archived are stages a recipient's link can reach without anyone being notified. The estimate's own recipients list is where you follow those; Sending estimates walks through all seven statuses.
Notifications as they happen
Notifications also arrive live. If you have the application open when something happens, a short message slides into the corner of the screen and the bell's badge updates without you refreshing the page.
Each notification is written in the language you were using when it arrived, and it keeps that wording afterwards. Switching languages on the Appearance page changes the application around it, but the notifications already in your list stay as they were sent. It also means teammates working in different languages each read the same event in their own.
Sending estimates covers the review process that produces all of this.
Related pages
- Quick Setup gets the account ready so the Dashboard has something to show.
- Workflows by business type is the long-form version of the Business Workflows checklist.
- Burn Rate covers where your hours and your price floor come from.
- Managing estimates explains the outcomes behind the Estimate Outcomes chart.